Symposium - 2023 – Access to Justice
The Making of the A2J Crisis
Nora Freeman Engstrom & David Freeman Engstrom
After decades of neglect, access to justice has roared onto legal and political radars, fueled by a growing realization—first among lawyers but increasingly among the wider American public—that the civil justice system is in crisis. In roughly three-quarters of the 20 million civil cases filed in state courts each year, one side lacks a lawyer—a dynamic that poses a direct challenge to the system’s adversarial core. 1 .See, e.g., Jessica K. Steinberg, Adversary Breakdown and Judicial Role Confusion in “Small Case” Civil Justice, 2016 BYU L. Rev. 899, 901 (exploring the rise of the “unrepresented majority” and other factors as contributors to the “breakdown of adversary procedure” in two-party civil cases). For the 75% figure, see Nat’l Ctr. for State Cts., The Landscape of Civil Litigation in State Courts, at iv (2015) [hereinafter Landscape Study]. See also Family Justice Initiative: The Landscape of Domestic Relations Cases in State Court, at ii (2018) (reporting that, in domestic relations cases, “the majority of cases (72%) involved at least one self-represented party”) [hereinafter Landscape of Domestic Relations]. And these are the cases and litigants we can see. Beneath them lies a larger but hidden crisis. It consists of tens of millions more Americans who face genuine legal problems but take no formal legal action to protect their interests. 2 .See Rebecca L. Sandefur, What We Know and Need to Know About the Legal Needs of the Public, 67 S.C. L. Rev. 443, 446-48 (2016) (reviewing national surveys and reporting that there are “well over 100 million Americans living with civil justice problems” and that the majority take no formal legal action to address the problem). As this double-layered calamity has come into focus, state supreme courts, bar associations, and even the crusty American Law Institute are taking note. 3 .See High-Volume Civil Adjudication, Am. L. Inst., https://perma.cc/ESB6-XFZN (archived Mar. 31, 2024).
Just as most agree the status quo is not tenable, a consensus is forming around possible fixes. The usual menu begins with the obvious and (mostly) uncontroversial: more legal aid, more pro bono, and system simplification so that even those without lawyers can navigate it. The menu continues with more ambitious (and more controversial) reforms: relaxing unauthorized practice of law (UPL) restrictions to admit non-lawyers into the system; greater reliance on technology, from Zoom hearings and online dispute resolution (ODR) platforms to new tech-enhanced form-filling and filing systems; more experiments with discipline-spanning service models, such as “medical-legal partnerships”; and even reorienting the judicial role to something more active and “inquisitorial.” 4 .See Bruce A. Green, Civil Justice at the Crossroads: Should Courts Authorize Nonlawyers to Practice Law?, 75 Stan. L. Rev. Online 104 (2023) (UPL); David Freeman Engstrom & R.J. Vogt, The New Judicial Governance: Courts, Data, and the Future of Civil Justice, 72 DePaul L. Rev. 171 (2023) (legal technologies, including ODR); Yael Zakai Cannon, Medical-Legal Partnership as a Model for Access to Justice, 75 Stan. L. Rev. Online 73 (2023) (medical-legal partnerships); Anna E. Carpenter, Jessica K. Steinberg, Colleen F. Shanahan & Alyx Mark, Studying the “New” Civil Judges, 2018 Wis. L. Rev. 249 (2018) (the shifting judicial role). At the far end of the continuum sit reforms that are even more ambitious—and likely unachievable in their idealized forms. Think here of a full-fledged constitutional right to counsel, known as “civil Gideon”; “delegalization,” which would remove certain case types entirely from court cognizance; or a fortified welfare state to better insulate people from income shocks, which would avoid civil justice entanglement in the first place. 5 .See, e.g., Lauren Sudeall, Delegalization, 75 Stan. L. Rev. Online 116 (2023) (delegalization); Juliet M. Brodie & Larisa G. Bowman, Lawyers Aren’t Rent, 75 Stan. L. Rev. Online 132 (2023) (welfare policy, especially in housing). It’s telling—and a tribute to the Editors of the Stanford Law Review—that so many of these reform ideas, from all points along the continuum, are reflected in the Volume 75 Symposium issue.
In this Essay, we take a different tack. Rather than look forward, we look back. In particular, we ask: How did we get here? How did we reach a point where a majority of civil cases pit represented parties against unrepresented ones? 6 .Landscape Study, supra note 1, at iv. How can it be that the modal case in all of American law-dom is a debt collection action? 7 .Id. at iii (noting that debt collection cases constitute 37% of state civil filings). Has it always been this way—and, if not, what has precipitated the current crisis?
This is no abstract, academic exercise. We excavate the origins of the access to justice crisis because we believe that only by understanding its creation can we select the right options from a growing menu of potential fixes. Then, and only then, can we begin to chart a sensible path forward.
This Essay proceeds in four Parts. Part I asks whether the civil justice system is actually in crisis, and if so, when it fell into disrepair. Marshalling the best available evidence, we conclude that the current crisis is real—although not entirely new. For nearly a century, observers have warned us, with growing urgency, about the public’s “unfilled need for legal services.” 8 Lloyd P. Derby, The Unauthorized Practice of Law by Laymen and Lay Associations, 54 Calif. L. Rev. 1331, 1332 (1966) (“The public, particularly in the lower- and middle-income levels, has an unfilled need for legal services.”); see also, e.g., Lowell Turrentine, Legal Service for the Lower-Income Group, 29 Or. L. Rev. 20, 20 (1949) (“To find a way of bringing legal service within the means of this major fraction of our people is without doubt the greatest problem faced by the bar today . . . .”). Yet that does not mean that today’s crisis simply continues that familiar refrain. To the contrary, though data are fragmentary, the current season of the access-to-justice crisis is likely different in kind than its predecessors, and it is almost certainly different in scale.
Parts II and III tackle the “why” question. Part II identifies and then discounts four common explanations for the current problems. These include cuts to legal aid funding, a shrinking “PeopleLaw” segment of the legal services industry, growing rights consciousness, and individuals’ increasing desire to go it alone.
Part III then offers two more plausible culprits that better explain the current moment. First is growing economic insecurity that has created a large mass of Americans who are “poverty-eligible”—unable to weather any nontrivial shock to their finances. When they are hit by bills they can’t pay (often after a hospital visit they didn’t expect), debt collections and evictions frequently follow.
We call the second explanation “technology’s affordances and asymmetries,” and it’s more nuanced. At its core is the fact that institutional plaintiffs (think debt collectors, large landlords, and hospitals) now dominate state court dockets. These institutional plaintiffs have built business models around high-volume litigation practices, in large part by leveraging “legal tech,” from e-filing to AI. Yet the legal tech that serves individual Americans on the other side of the “v” remains clunky and limited. The result is a lopsided litigation landscape that’s wreaking havoc on litigants and courts alike.
After mapping and identifying the roots of the current A2J crisis, Part IV steps through some implications. Among them is the insight that the everyday realities of the American civil justice system have shifted out from under the foundational assumptions, procedural frameworks, and formal commitment to adversarialism upon which it was built. The challenge of the A2J crisis is not just its magnitude, which makes scalable solutions imperative. It is a deeper institutional mismatch—and an existential challenge to courts as we know them—raising difficult but answerable questions about how and where to begin.
I. The “What” and “When” Questions
Three clear statistical trends define the state civil justice system in recent decades: the ascendance of contract claims, mostly debt collections and evictions; an uptick in default judgments; and, though the data are murky, a substantial growth in self-represented litigants (SRLs).
First, recent decades have witnessed a tectonic shift in state courts’ case composition. Thirty years ago, state court civil litigation was often initiated by individuals who, consistent with popular imagination, could hold corporations and government actors to account. 9 .See Landscape Study, supra note 1, at 7. For more on the fall of tort litigation, the prototypical site where individuals could hold governmental and corporate actors to account, see Joe Palazzolo, We Won’t See You in Court: The Era of Tort Lawsuits Is Waning, Wall St. J. (July 24, 2017, 5:09 PM ET), https://perma.cc/Q7HA-8SWA. No longer. Once neck and neck, tort has been steadily displaced by contract, mostly debt collection and landlord-tenant matters pitting institutional plaintiffs against individual defendants. 10 For how contract cases have steadily displaced tort cases, see Landscape Study, supra note 1, at 7 (1992 figures); id. at 17 (more recent figures). Excluded from the study are cases involving domestic relations. See id. at iii. If those were included, the share of contract law cases would no doubt drop.For more on the increasing prevalence of entity suits against individuals, see Pew Charitable Trs., How Debt Collectors Are Transforming the Business of State Courts 1 (2020) (explaining that state court dockets are now “dominated not by cases involving adversaries seeking redress for an injury or business dispute, but rather by cases in which a company represented by an attorney sues an individual, usually without the benefit of legal counsel, for money owed”); Paula Hannaford-Agor, The Landscape of Civil Litigation in State Courts: Examining Debt Collection, Landlord/Tenant and Small Claims Cases 3-4 (2019) (noting high numbers of cases pitting “entity” plaintiffs against individuals); Chris Albin-Lackey, Hum. Rts. Watch, Rubber Stamp Justice: US Courts, Debt Buying Corporations, and the Poor 1 (2016) (“Debt buyer lawsuits typically play out before the courts with a stark inequality of arms, pitting unrepresented defendants against seasoned collections attorneys.”). The upshot is that contemporary state courts are less where individuals are acting; they are now far more frequently a place where individuals are acted upon.
A second tectonic shift is an increase in uncontested cases. Primed by Hollywood courtroom dramas, Americans picture litigation as a climactic clash of adversaries. But in many jurisdictions and in certain litigation areas (again, most prominently debt collection actions), the majority of lawsuits never draw a responsive pleading and, as a result, end in default judgment. 11 .See, e.g., Peter A. Holland, Junk Justice: A Statistical Analysis of 4,400 Lawsuits Filed by Debt Buyers, 26 Loy. Consumer L. Rev. 179, 208, 210 (2014) (reviewing 4,400 debt collection cases and reporting that, of the roughly 3,000 consumers who were properly served, 85% did not file a response, 13% filed a pro se response, and 2% had counsel); Pew Charitable Trs., supra note 10, at 16 (reporting that “more than 70% of debt cases end in default judgments”); Victor Geminiani, Jennifer F. Chin & Isaiah Feldman-Schwartz, Laws. for Equal Just., Evicted in Hawaii: Lives Hanging in the Balance 24 (2018) (reporting a 45% default judgment rate in Hawaii eviction cases from 2010 to 2016); Hum. Rts. Watch, supra note 10, at 33 (“[B]etween 60 and 95 percent of all debt collection lawsuits, including debt buyer cases, end with default judgments in favor of the plaintiffs.”). As the National Center for State Courts puts it: “With the exception of cases filed in limited jurisdiction courts, . . . very little formal adjudication is taking place in state courts at all.” Landscape Study, supra note 1, at 23. A fair estimate is that, between 1992 and 2013, the overall default judgment rate in state courts at least doubled. 12 This conclusion derives from the 1992 and 2013 NCSC studies described below, but it requires some explanation. In 1992, the reported default judgment rate across all cases was 14%, and no other reported disposition category in the study could contain default judgments. Landscape Study, supra note 1, at 7. By contrast, in 2013, the default judgment rate was 20% across all cases, but with two caveats. Id. at 20. First, in addition to the “Default judgment” category, the 2013 data contained a large number of dispositions—26% across all court types—coded as “Judgment (unspecified),” a category that concededly included both default judgments and “adjudication[s] on the merits in a bench or jury trial.” Id. As the report authors noted, a large portion of these latter dispositions were likely default judgments, not trials, but couldn’t be specified based on case management data as opposed to the hand-coding of the earlier study. Id. at 20-22. Second, in the 2013 data, the default judgment rate was somewhat lower (18%) in general jurisdiction courts, substantially lower (3%) in single-tier courts, but somewhat higher (32%) in limited jurisdiction courts. Id. at 21. The latter courts were not included in the 1992 study and yet made up some 45% of the 2013 data sample. Id. at 17 (finding 417,063 cases in the study’s sample of 925,344 were limited jurisdiction cases). As a result, the default judgment rate in the 2013 data could, in theory, be as high as 46% but, fairly read, is more likely closer to 25% or 30%, a two-fold increase over the 14% finding from 1992.
The third tectonic shift is significant growth in the proportion of SRLs in state courts—though quantifying the uptick is difficult. When discussing rising SRLs, the obligatory cite is a valiant effort by the National Center for State Courts (NCSC) to map an unwieldy state court system in 1992 and then again in 2013. On the face of it, the NCSC’s findings are stark: In 1992, both parties were represented in 98% of tort cases, 94% of contract cases, and 93% of real property cases. 13 .Id. at 31. In 2013, those numbers had dropped to 64%, 20%, and 39%, respectively, with nearly all of the drop coming from defense-side SRLs, not plaintiffs. 14 .Id. at 31-33 (reporting that, in general jurisdiction courts, plaintiff-side representation declined only slightly, from 99% to 96%, whereas defendant-side representation decreased from 97% to 46%). Findings for trials—rare events in the civil justice system, but providing apples-to-apples traction—showed similar declines. 15 .Id. at 28 (showing a decline in the proportion of bench trials—which far outnumber jury trials—featuring attorneys on both sides from 91% to 24%).
Unfortunately, however, problems with these oft-cited figures abound. Look under the hood of the NCSC studies and one finds numerous reasons the 1992 numbers are inflated, including key differences in the courts surveyed 16 The 1992 data do not consider limited-jurisdiction courts—including the small-claims courts that are many debt collectors’ forum of choice—but those courts comprise a large portion of the 2013 sample. Id. at 6, 14. and how represented status is coded. 17 The 1992 study sometimes codes a party as “represented” if accompanied by counsel at any point in a case while the 2013 data deploy the opposite presumption, coding parties as “self-represented” if lacking a lawyer at any time in a case or, where court data isn’t detailed enough, “at disposition.” Landscape Study, supra note 1, at 31 n.83. Another obvious source of inflation is that the 1992 statistics appear to capture representation only in contested cases—that is, where the defendant filed an answer or made an appearance, while the 2013 data count nearly all defaulting defendants as unrepresented. See Dalié Jiménez, Decreasing Supply to the Assembly Line of Debt Collection Litigation, 135 Harv. L. Rev. F. 374, 377-79 (2022). Policymakers should view claims based on the NCSC’s statistics with caution. Other studies, which tend to be local and context-specific, paint a similarly murky portrait. Some indicate that there was a mounting crisis in SRLs in debt, 18 .David Caplovitz, Consumers In Trouble: A Study Of Debtors In Default 213-15, 222-24 (1974); Hillard M. Sterling & Philip G. Schrag, Default Judgments against Consumers: Has the System Failed?, 67 Denv. U. L. Rev. 357, 358, 386-87 (1990). housing, 19 .See Barbara Bezdek, Silence in the Court: Participation and Subordination of Poor Tenants’ Voices in Legal Process, 20 Hofstra L. Rev. 533, 535, 538 (1992); see also Jona Goldschmidt, Barry Mahoney, Harvey Solomon & Joan Green, Am. Judicature Soc’y, Meeting the Challenge of Pro Se Litigation: A Report and Guidebook for Judges and Court Managers 9, 142 (1998) (noting court study showing pro se litigants in 28 percent of landlord-tenant cases in Chicago by 1994) (citing Cir. Ct. of Cook Cnty. Pro Se Advisory Comm., Report on Pro Se Litigation 2 (1995)); Howard M. Rubin, The Civil Pro Se Litigant v. The Legal System, 20 Loy. U. Chi. L.J. 999, 999 (1989) (noting “severe” pro se problem in housing court, among other areas). and family 20 A much-cited set of studies in Maricopa County, Arizona found a sharp rise in SRLs in divorce cases, from 24% to nearly 90%, between 1980 and 1990. See Bruce D. Sales, Connie J. Beck & Richard K. Haan, Am. Bar Ass’n, Self-Representation in Divorce Cases, at ii-v (1993); Steven R. Cox & Mark Dwyer, Am. Bar Ass’n, A Report on Self-Help Law: Its Many Perspectives 21-22 (1987); see also Drew A. Swank, The Pro Se Phenomenon, 19 BYU J. Pub. L. 373, 376 (2005) (reporting a sharp rise in SRLs in California divorce cases in the 1970s and 1980s); Frances L. Harrison, Deborah J. Chase & L. Thomas Surh, California’s Family Law Facilitator Program: A New Paradigm for the Courts, 2 J. Ctr. Fams., Child. & Cts. 61, 61 (2000) (“By 1995, approximately 65 percent of California divorces were brought by pro se litigants.” (citing Maggie Vincent, Note, Mandatory Mediation of Custody Disputes: Criticism, Legislation, and Support, 20 Vt. L. Rev. 280 (1995)); Deborah L. Rhode & Ralph Cavanagh, Note, The Unauthorized Practice of Law and Pro Se Divorce: An Empirical Analysis, 86 Yale L.J. 104, 149 (1976) (studying divorce cases from 1975 in Connecticut and finding that, of uncontested divorces, only one party was represented in over half the cases); Patricia L. Winks, Divorce Mediation: A Nonadversary Procedure for the No-Fault Divorce, 19 J. Fam. L. 615, 625 (1980) (reporting that, in Los Angeles County in 1977, more than one in four divorces were filed pro se, whereas “ten years before, the proportions were one in a thousand”). cases in the 1980s and perhaps even earlier. Other studies, however, including seemingly comprehensive ones, indicate that growth in SRLs during the 1990s was, in many or most places, merely “moderate” and not anything like a crisis level. 21 .Compare Beth Lynch Murphy, Am. Judicature Soc’y, Results of a National Survey of Pro Se Assistance Programs: A Preliminary Report 3 (2000) (reporting results of national survey of court officials and finding that most respondents thought the SRL rise “moderate”), with Goldschmidt et al., supra note 19, at 8 (reporting results of a different survey of judges and court managers and finding that SRLs had risen substantially).
Fortunately, new efforts are underway to improve upon these imperfect numbers. Those efforts may well conclude that pro se rates have always been high in certain places or cases, even if the absolute numbers of SRLs do not approach the recent rise. But none are likely to undermine the conclusion that something happened in recent decades. State courts have been steadily transformed by the waning of lawyer-centered adversary litigation, perhaps first in family law but then spreading to mostly contract-related areas amidst an explosion of debt collection actions and a steady, but smaller, rise in evictions. We now turn to the “why” of this stark transformation.
II.The “Why” Question: Common But Unpersuasive Explanations
What caused the above transformation? Four theories are frequently voiced but, on closer inspection, enjoy only limited explanatory power.
A. Lagging Legal Aid
Some insist that a chief culprit for the A2J crisis is stagnant or declining legal aid funding. 22 .Goldschmidt et al., supra note 19, at 10 (“The recent cutbacks in federal and state legal services appropriations are surely another cause of increased pro se litigation.”); Rebecca Buckwalter-Poza, Making Justice Equal, Ctr. for Am. Progress (Dec. 8, 2016), https://perma.cc/P96G-5ZNW (“Today, unmet legal needs are at an unacceptable level and growing as civil legal aid funding is shrinking.”). There’s something to this: In inflation-adjusted dollars, the Legal Services Corporation (LSC), the country’s largest supplier of legal aid funding, pockets about half what it received at its peak in 1979. 23 .See David Reich, Additional Funding Needed for Legal Services Corporation, Ctr. on Budget & Pol’y Priorities: Off the Charts (Feb. 1, 2021), https://perma.cc/5NUR-DVRL (explaining that the LSC received $465 million in 2021 and, in inflation-adjusted dollars, received roughly $1 billion in 1979). But a closer look at the data puts the lie to the legal aid idea: While LSC funding has declined, legal aid funding in general—which comes from a mix of state-level appropriations, foundation and corporate grants, Interest on Lawyers’ Trust Accounts (IOLTA) funds, and court fines and fees—more than doubled between 2003 and 2021 in inflation-adjusted dollars. 24 ABA Res. Ctr. for Access to Just. Initiatives, ABArray Legal Aid Funding Report: U.S. Funding for Legal Aid, Tableau (updated Nov. 30, 2022), https://perma.cc/QDT6-GVYP (showing that legal aid funding was $940 million in 2003 and $2.78 billion in 2021). According to the usual CPI Inflation Calculator, $940 million in 2003 was worth $1.38 billion in 2021. What’s more, even if legal aid funding has stagnated, that fact would not explain massive changes in the composition of civil dockets. In sum: We could (and should) expand legal aid funding. But we haven’t gotten where we are because of budget cuts, and even a vast increase over current commitments would barely dent the current crisis.
B. Shrinking “PeopleLaw”
Another common line of argument focuses on changes in the legal services marketplace. In particular, PeopleLaw, the segment of the bar that serves individuals and small businesses (as against BigLaw’s corporate focus), has shrunk even as unmet civil legal need has grown. This argument suggests that lawyers have stopped serving ordinary Americans—and that this professional pivot has paved the way for the current crisis. 25 .See, e.g., Stephan Landsman, The Growing Challenge of Pro Se Litigation, 13 Lewis & Clark L. Rev. 439, 443 (2009) (“[C]hanges in the legal profession . . . have tilted the market away from individuals toward corporate clients.”).
As with claims about legal aid, there’s a statistical foothold here. In 1967, 55% of lawyer time went to individuals, whereas only 39% went to businesses. 26 .Marc Galanter, Lowering the Bar: Lawyer Jokes and Legal Culture 281 n.81 (2005). But by the mid-1990s, the situation had flipped: more than half of lawyer time—according to some estimates, as much as 64%—went to businesses. 27 .Id. (reporting 40% of lawyer time went to individuals and 51% to businesses in 1992); John P. Heinz, Robert L. Nelson, & Edward O. Laumann, The Scale of Justice: Observations on the Transformation of Urban Law Practice, 27 Ann. Rev. Socio. 337, 340 (2001) (reporting the 64% figure, with 29% of lawyer time going to individuals and small businesses); Landsman, supra note 25, at 443-44 (compiling these statistics). More recent earnings data show a similar trend: Between 2007 and 2012, law firm receipts from individuals fell by nearly $7 billion even though total receipts rose from $225 to $246 billion. 28 Bill Henderson, The Decline of the PeopleLaw Sector, Legal Evolution, Nov. 19, 2017, https://perma.cc/5Q86-ZD7Z.
But here again, as a cause of the A2J crisis, this explanation is thin. For starters, the timelines don’t mesh: A shift in the legal profession’s center of gravity between its “hemispheres” has been in motion for perhaps a century. 29 .See Richard L. Abel, American Lawyers 9-11, 202-07 (1989) (noting the steady decline of sole practitioners beginning in the 1940s, the rise of large law firms over the same period, particularly since the 1970s, the steady increase in the ratio of lawyer receipts from corporate versus individual clients beginning in the 1940s, and a steadily widening income gap between the two hemispheres from the 1930s to the present). And, while it’s possible that the shift has recently accelerated, there’s no evidence that it has moved enough to explain the above trends.
More fundamentally, the economics—and the causal arrows—are off: If PeopleLaw were viable, that’s the kind of law lawyers would practice. Lawyers haven’t (irrationally) turned their backs on happy-to-pay clients. There must be something else at play. What might that something else be?
Here, the PeopleLaw argument decomposes into other equally thin explanatory possibilities. For instance, perhaps the cost of delivering legal services has risen in recent decades. Or perhaps litigation itself has grown more expensive—think here of the expansion of summary judgment or costly e-discovery.
There are grains of truth here but plenty of problems, too. Rising costs should show up in fees, but fees have mostly held steady over the past two decades, at roughly $300 per hour (in inflation-adjusted dollars). 30 .See, e.g., U.S. Atty’s Off. for the Dist. of Columbia, USAO Attorney’s Fees Matrix—2015-2021 (n.d.), https://perma.cc/KH4M-PCQN (calculating “reasonable,” or average, fees for attorneys with one or two years of experience to be roughly $300 per hour in inflation-adjusted dollars); Clio, Legal Trends Report 2020, at 78 (2020) (charting gradual nominal growth from 2010 to 2021). That’s pricey even for relatively well-heeled Americans, but it doesn’t explain the uptick in SRLs. As for thickening procedures, it’s just as plausible that the system has gotten too streamlined in high-volume dockets, not the opposite. 31 .See Kathryn A. Sabbeth, Eviction Courts, 18 U. St. Thomas L.J. 359, 398 (2022) (suggesting that streamlining has encouraged landlords to use eviction as a tool (citing Sarah Abdelhadi & Ranya Ahmed, Legal Servs. Corp., Fast & Cheap: The Speed and Cost of Evicting Tenants for Nonpayment of Rent 9 (2021)). But see Nicole Summers, Eviction Court Displacement Rates, 117 Nw. U. L. Rev. 287, 302 (2022) (noting lack of rigorous empirical evidence connecting procedures and substantive eviction outcomes).
In short, PeopleLaw shrinkage, by itself, does not get us very far. As we argue in Part II.B., there is good evidence that a convergence of forces—from restrictive rules governing legal practice to an innovation-stymieing checkerboard of court technology systems—has thwarted urgently needed adaptation within the legal services marketplace. If there were that adaptation, it is possible that the PeopleLaw segment of the market would rebound—and that rebound could, in turn, fuel a decline in default judgments and SRLs. But when it comes to explaining the current A2J crisis, PeopleLaw shrinkage is more a canary in the coalmine than a root cause.
C. Rights Consciousness and Individual Capacity
A third commonly articulated explanation tells a happier story, centered around rights consciousness, turbocharged by increased access to information. On this view, the prevalence of poor people on court dockets dates to the 1960s and 1970s, when a growing expectation of “total justice” and a nascent public interest law movement worked a sea change in Americans’ relationship to courts. 32 .See Lawrence M. Friedman, Total Justice 43, 147 (1985) (discussing Americans’ shifting expectations regarding legal entitlement to recompense for harms); Judith Resnik, Migrating, Morphing, and Vanishing: The Empirical and Normative Puzzles of Declining Trial Rates in Courts, 1 J. Empirical Legal Studs. 783, 785, 804-11 (2004) (arguing that the changing conception of state obligations to individuals fueled “an expansionary adjudicatory project premised on widespread acceptance of the desirability of adjudication as a process for making decisions enforced by the state”). New causes of action were minted, procedures were liberalized, and more people “went to law” to vindicate rights. 33 .See, e.g., Goldschmidt et al., supra note 19, at 10 (attributing the pro se rise, in part, to “the creation of new causes of action by the legislature” (quoting Minn. Conf. of Chief Judges, Report of the Chief Judges’ Committee on the Treatment of Litigants and Pro Se Litigation 6 (1996)); Peter L. Murray & John C. Sheldon, Should the Rules of Evidence Be Modified for Civil Non-Jury Trials?, 17 Me. Bar J. 30, 32 (2002) (attributing the pro se rise, in part, to “legislative creation of new causes of action”). Some accounts add a digital twist: with the help of the internet, more individuals have the capacity to download forms, get advice, and confidently initiate actions pro se. 34 Lara Monica Czajkowski Higgins, On Pro Se Litigants: Three Judges’ Views, Wis. Law., Mar. 2017, at 40, 41 (offering online assistance as an explanation for the rise in pro se filings in Wisconsin); accord Jona Goldschmidt, The Pro Se Litigant’s Struggle for Access to Justice: Meeting the Challenge of Bench and Bar Resistance, 40 Fam. Ct. Rev. 36, 36 (2002) (declaring that the growth in pro se litigation is attributable to, inter alia, “increased literacy, consumerism, [and] a sense of rugged individualism”). The uptick in SRLs, on any of these theories, should be cause for celebration, not despair.
Unfortunately, the nature of case filings undercuts this hypothesis. As noted, the modal case in state courts is a debt collection action, followed by landlord-tenant disputes; foreclosure actions also figure prominently. 35 .Landscape Study, supra note 1, at iii, 19. These cases are not filed by plucky self-represented litigants, flush with a thick sense of justice, seeking to vindicate their rights. Rather, the lawsuits that dominate court dockets are being assembly-lined by (represented) banks, collection agencies, corporate landlords, and other institutional players, 36 .E.g., Paul Kiel, So Sue Them: What We’ve Learned About the Debt Collection Lawsuit Machine, ProPublica (May 5, 2016, 7:57 AM EDT), https://perma.cc/W9ZK-KE9R (studying civil filings in Indiana from 2010 to 2014 and finding that the four most common plaintiffs were major banks, hospitals and other medical providers, collection agencies, and debt buyers). and the sharp rise in SRLs is on the defendant, not plaintiff, side of the “v.” 37 .See supra note 14 and accompanying text. See also Landscape of Domestic Relations, supra note 1, at 20 (reporting in domestic relations cases that “[p]etitioners were more likely to have retained counsel than respondents, 42 percent to 23 percent overall, respectively”).
D. Individual Choice
A final and related argument holds that high rates of self-representation reflect individual choice—that individuals, holding a “negative perception of lawyers,” are simply opting to “take control of their legal affairs” and go it alone. 38 Beverly W. Snukals & Glen H. Sturtevant, Jr., Pro Se Litigation: Best Practices from a Judge’s Perspective, 42 U. Rich. L. Rev. 93, 100 (2007); see also Goldschmidt et al., supra note 19, at 10 (“Anti-lawyer sentiment . . . has influenced the growth of self representation.”); Murray & Sheldon, supra note 33, at 32 (“There are several explanations for the recent increase in self-representation . . . [including] growing anti-lawyer sentiment.”). As one commentator put it: “It seems that the anti-lawyer sentiment all over the country is what is fueling this growth of self-representation.” 39 Deborah M. Tate, “If We Build It Will They Come?”, R.I. Bar J., Feb. 2000, at 3, 3.
But this explanation is also somewhat unsatisfying. For one, the underlying assumption (that there is a groundswell in anti-lawyer sentiment) is dubious. Commentators have lamented public distrust of lawyers for ages; it’s not new. 40 .E.g., James Willard Hurst, The Growth of American Law: The Law Makers 252 (1950) (“Whether mistaken, unjust, or hypocritical, the unfavorable popular image of the lawyer was a reality throughout our social history.”). Nor do contemporary surveys capture any such groundswell. According to Gallup, views of lawyers as honest and ethical have fluctuated over decades, but there haven’t been sharp shifts. 41 .See Honesty/Ethics in Professions, Gallup, https://perma.cc/4H2E-RP2V (archived Mar. 31, 2024).
Nor does the explanation mesh with what SRLs themselves say. When asked why they are representing themselves, pro se litigants don’t typically highlight their distrust of lawyers; they more often point to economic necessity. 42 .E.g., Christie Loveless, Inst. for Ct. Mgmt., Evaluating Pro Se Litigation at the Tarrant County Family Law Center app. E at E-5 tbl. 11 (2012) (reporting that, when asked, “Why did you choose to represent yourself in your legal matter?” 66% reported the reason for representing themselves is, “I cannot afford an attorney,” whereas only 10% answered “I do not trust attorneys” and only 3% answered “I want to have control over my case”); Natalie Anne Knowlton, Logan Cornett, Corina D. Gerety & Janet L. Drobinske, Cases Without Counsel: Research on Experiences of Self-Representation in U.S. Family Court 2, 18 (May 2016) (concluding, based on interviews with SRLs, that “[s]elf-represented litigants in family court largely desire legal assistance, advice, and representation” but are priced out of the market for legal services, while further noting that most interviewed SRLs “did not wish to represent themselves, and in fact, would have welcomed the involvement of an attorney”); see also Jessica K. Steinberg, Demand Side Reform in the Poor People’s Court, 47 Conn. L. Rev. 741, 752 (2015) (“[M]ost studies that have examined the characteristics of unrepresented litigants conclude that poverty is the primary force driving individuals to represent themselves in court.”). It’s also telling that areas with higher rates of SRLs tend to “have a lower median income (adjusted for the cost of living) and a lower percentage of the population having college degrees,” as compared to those places with lower rates of SRLs. 43 .Landscape of Domestic Relations, supra note 1, at 21. Also suggestive: According to the majority of surveyed judges, the Great Recession was associated with an uptick in pro se litigation activity. See Linda Klein, Am. Bar Ass’n Coalition for Justice, Report on the Survey of Judges on the Impact of the Economic Downturn on Representation in the Courts (Preliminary) 2 (2010). Further, many current SRLs do not actually represent themselves; default judgment rates indicate that many never appear. 44 .See, e.g., Pew Charitable Trs., supra note 10, at 16.
Now, buried within this “distrust” hypothesis is one with greater purchase: As Sara Sternberg Greene’s research shows, distrust of the system—fueled by the blistering experiences of many Americans (especially communities of color) on the criminal side of the system—may cause some to steer clear of courts altogether. 45 .See, e.g., Sara Sternberg Greene, Race, Class, and Access to Civil Justice, 101 Iowa L. Rev. 1263, 1266-68 (2016) (finding that both income- and race-related differences in perceptions of the justice system contributed to respondents’ likelihood of seeking legal representation). These dynamics are critically important and may help to explain why some individuals lump it, rather than initiate litigation, which could in turn explain the relative rise of institutional plaintiffs. But, when it comes to explaining trends, it’s not clear that systemic distrust has grown worse. And systemic distrust offers little insight as to why more people are proceeding pro se.
III. Two More Credible Culprits
We have considered—and mostly rejected—four commonly invoked explanations for the current crisis. Now, we pivot to explore two dynamics that, in our view, better explain current trends: increased “poverty eligibility” and what we call “technology’s affordances and asymmetries.”
A. Poverty Eligibility and Financial Risk
Over the past few decades, American poverty rates have stayed relatively constant. 46 The U.S. poverty rate has ping-ponged between roughly 10% and 15% since 1970, with no clear trend. See John Creamer, Emily A. Shrider, Kalee Burns & Frances Chen, U.S. Census Bureau, Rep. No. P60-277, Poverty in the United States: 2021, at fig. 1 (2022). But, as Jacob Hacker has powerfully explained, economic instability and vulnerability are both up dramatically. 47 .See Jacob S. Hacker, The Great Risk Shift: The New Economic Insecurity and the Decline of the American Dream 2, 14 (rev. & expanded ed. 2008) (highlighting that American income instability—”how far people slip down the ladder when they lose their financial footing”— has risen even faster than inequality). More people are, in effect, “poverty-eligible,” clustered on the edge of financial ruin.
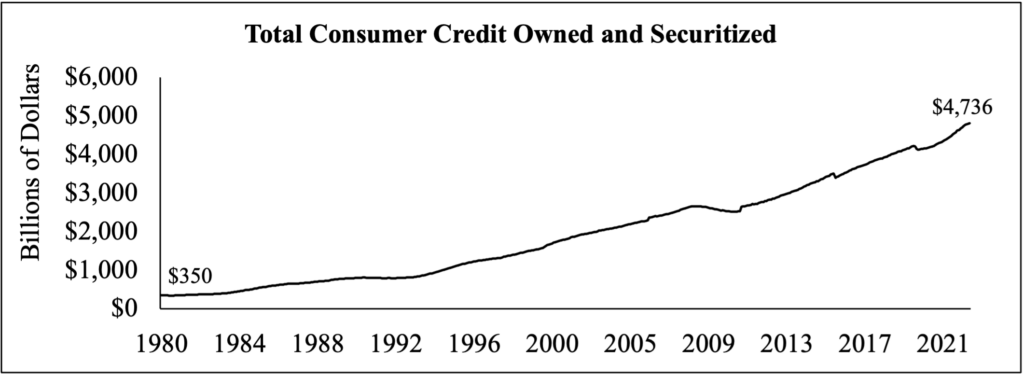
Part of this poverty eligibility is reflected in skyrocketing consumer debt. Growth in debt (roughly 450% over the past three decades) dates to the 1990s, a time of national prosperity, lax regulatory oversight, and the credit card industry’s rapid market expansion. 48 For the uptick, see Total Consumer Credit Owned and Securitized, Fed. Rsrv. Econ. Data, https://perma.cc/2RRA-GN7V (last updated Nov. 7, 2023) (charting growth in consumer debt through the 1990s and beyond). For a discussion of the trends that contributed to the uptick, see Tamara Draut & Javier Silva, Dēmos, A Network for Ideas and Action, Borrowing to Make Ends Meet: The Growth of Credit Card Debt in the ‘90s, at 17, 33-37 (2003). Over that decade, the industry lowered minimum monthly payments, aggressively marketed to customers, and opened the spigots, showering Americans with easy credit. 49 .Draut & Silva, supra note 48, at 37.
Source: Total Consumer Credit Owned and Securitized, Federal Reserve Economic Data.
Alongside this uptick in consumer debt has come a depletion in household savings. 50 .Pew Charitable Trs., supra note 11, at 18 (reporting that one-third of Americans report no savings). Indeed, in one recent survey, over one-third (36%) of Americans reported that their credit card debt eclipsed emergency savings. 51 Lane Gillespie, Bankrate’s 2023 Annual Emergency Savings Report, Bankrate (June 22, 2023), https://perma.cc/QHV3-FEWT. In another, a majority (56%) said they could not weather a $1,000 emergency hit. 52 Carmen Reinicke, 56% of Americans Can’t Cover a $1,000 Emergency Expense with Savings, CNBC (updated Jan. 19, 2022), https://perma.cc/MF83-C28N.
Part of this precarity comes from the brutal one-two punch of the Great Recession, then COVID-19. But longer-running trends are just as powerful—probably more so. For decades, wages have barely kept up with (and often lagged behind) inflation. 53 Drew DeSilver, For Most U.S. Workers, Real Wages Have Barely Budged in Decades, Pew Rsch Ctr. (updated Aug. 7, 2018) (“After adjusting for inflation, . . . today’s average hourly wage has just about the same purchasing power it did in 1978 . . . .”). At the same time, housing and health care costs have dramatically outpaced it. Between 2000 and 2021, median rent more than doubled in inflation-adjusted dollars, from $483 to a staggering $1,216. 54 .See Quarterly Median Asking Rent and Sales Price of the U.S. and Regions: 1988 to Present, U.S. Census Bureau, https://perma.cc/4P77-AV9G (archived Mar. 31, 2024) (to locate, select “View the live page,” then select “Table 11A/B”). As a result, “[t]oday, over 1 in 5 of all renting families in the country spends half of its income on housing.” 55 .Matthew Desmond, Evicted: Poverty and Profit in the American City 303 (2016) (emphasis omitted). Adding to the squeeze: between 2000 and 2019, per capita expenditures on health care costs more than doubled. 56 .Gross Domestic Product, National Health Expenditures, Per Capita Amounts, Percent Distribution, and Average Annual Percent Change: United States, Selected Years 1960-2019, Ctrs. for Disease Control & Prevention, https://perma.cc/9TQN-7G3D (archived Mar. 31, 2024) (noting per capita spending on personal health care was $4,103 in 2000 and $9,787 in 2019).
Given this, we should not be surprised that debt is up while savings are down. Nor should we be surprised that debt collection actions and evictions, often traceable to sudden medical expenses, have surged. 57 Medical debt is the most common debt on consumer credit reports. CFPB, Medical Debt Burden in the United States 5 (2022); accord Lisa Stifler, Debt in the Courts: The Scourge of Abusive Debt Collection Litigation and Possible Policy Solutions, 11 Harv. L. & Pol’y Rev. 91, 95 (2017) (“The overwhelming majority of people who are in debt and are being pursued by debt collectors are not in debt by choice. Instead, they are likely dealing with some sort of unforeseen circumstances—unexpected job loss, divorce or marital problems, or serious illness.”). Nor should we be surprised that those same Americans—facing legal issues that emerge from financial precarity—don’t hire pricey lawyers when trouble comes.
B. Technology’s Affordances and Asymmetries
A second culprit is what we call “technology’s affordances and asymmetries.” In a nutshell, potent new technologies have ushered in a new era of litigation—but in lopsided fashion. This asymmetry has empowered institutional actors to the detriment of individual “one-shotters,” including SRLs.
This skewed dynamic is starkest, and thus easiest to see, in the debt collection context. As already noted, recent decades have seen a surge in consumer credit—and, though some debate the reasons, Americans have become more indebted. 58 .See generally Andrea Ryan, Gunnar Trumbull & Peter Tufano, A Brief Postwar History of U.S. Consumer Finance, 85 Bus. Hist. Rev. 461 (2011) (reviewing the contributions of consumerism, consumption patterns, and inequality to the multifaceted postwar history of consumer finance).
Now, this dynamic isn’t necessarily a negative. Access to cheap credit can be an engine of social mobility; we should worry about a world without it. But there is a dark side, as the expansion of consumer credit has (perhaps not coincidentally) come alongside new high-volume litigation practices for collecting debt. Harnessing technology, new institutional players have come to the fore and—working in tandem with a new breed of specialized law firms and “recovery facilitators” 59 .See Kiel, supra note 36 (tracking the rapid growth of debt buyers). —have fine-tuned ways to, as one player bluntly puts it, “manage collections litigation at scale.” 60 .Oliver Tech., https://perma.cc/D6J3-CS87 (archived Mar. 31, 2024). The same company boasts that it “enables creditors to use litigation on many more files by automating repetitive activity,” which “reduc[es] the cost of recovery.” Id.
Debt collection lawsuits have quickly become the 800-pound gorilla of state courts, accounting for at least one-quarter of all state civil filings. 61 .Landscape Study, supra note 1, at 18-19 (noting that debt cases make up 37% of contract cases, which in turn make up 64% of all cases). Note, however, that debt collection suits can also be filed in small claim courts in many states, id., which would very likely push the proportion of debt cases above one-quarter, perhaps substantially. And, they’ve achieved this status by growing fast. To give a sense: In a study collecting data from several of California’s most populous counties, debt collection cases rose eightfold, from some 30,000 in 2000 to a high of nearly 250,000 in 2008. 62 .See Hannah Locklear & George Simons, SoloSuit, Debt Collection Litigation Industry Report 2023, at 5 (2023). Cases declined in the post-recession years as the economy recovered, bottoming out at below 100,000 in 2015, but then rose sharply again to more than 200,000 in 2019. Id. at 5-6. Most recently, cases declined again to roughly 125,000, possibly due to the pandemic. Id. at 5-8. Other arresting statistics capture the scope and capacity of the current credit-industrial complex:
- In 2015 in the Massachusetts courts, nine debt buyers accounted for 43% of civil and small claims caseloads. 63 .Pew Charitable Trs., supra note10, at 12 fig.7.
- Between 2014 and 2016, Forster & Garbus, 64 .See Forster and Garbus LLP: A Wholly Owned Subsidiary of Abrahamsen Gindin LLC, Abrahamsen Gindin LLC, https://perma.cc/4S4R-U2QS (archived Mar. 31, 2024). a small law firm devoted to “creditor’s rights,” filed nearly 100,000 debt collection lawsuits. 65 Press Release, CFPB, CFPB Takes Action to Halt Debt Collection Mill from Bombarding Consumers with Junk Lawsuits (Jan. 11, 2023), https://perma.cc/LN38-MCGW (accusing the firm of filing claims “while having documents to support only a fraction of those debts”).
- In 2019, Midland Funding, a leading debt buyer, filed more than 122,000 cases, a figure equivalent to nearly half the number of civil filings in all federal district courts. 66 Daniel Wilf-Townsend, Assembly-Line Plaintiffs, 135 Harv. L. Rev. 1704, 1708 (2022). In 2019, 286,289 civil cases were filed across the nation’s federal courts. See Federal Judicial Caseload Statistics 2019, Admin. Off. of the U.S. Cts., https://perma.cc/EZ5A-ZYY8 (archived Mar. 31, 2024).
- In 2020, Portfolio Recovery Associates filed over 3,000 lawsuits in just one city (Chicago) in just one month (July). 67 Paul Kiel & Jeff Ernsthausen, Debt Collectors Have Made a Fortune This Year. Now They’re Coming for More, ProPublica (Oct. 5, 2020, 5:00 AM EDT), https://perma.cc/APS3-G5VA. For further discussion, see Press Release, CFPB, CFPB Orders Repeat Offender Portfolio Recovery Associates to Pay More Than $24 Million for Continued Illegal Debt Collection Practices and Consumer Reporting Violations (Mar. 23, 2023), https://perma.cc/U4US-ZMNR.
The economies of scale evidenced in these numbers are most easily seen in the consumer credit industry—but they aren’t limited to it. Technology has also cut landlords’ costs, from the back office to the courthouse, by making it easier to execute landlord-friendly leases, manage accounts, write and send demand letters, and assemble and file eviction pleadings. 68 For emerging studies of landlords’ high-volume litigation practices, see Matt Nowlin & Erik Steiner, Follow the Money: Indianapolis Evictions in 2022, SAVI (Aug. 5, 2022), https://perma.cc/4XAX-2XWZ; Lillian Leung, Peter Hepburn & Matthew Desmond, Serial Eviction Filing: Civil Courts, Property Management, and the Threat of Displacement, 100 Soc. Forces 316 (2020). On landlord-friendly leases, see David A. Hoffman & Anton Strezhnev, Leases as Forms, 19 J. Empirical Legal Stud. 90 (2022). Even government actors have developed tech-fueled, high-volume litigation practices to scale enforcement of child support policies. 69 On high-volume enforcement practices, see Off. of Child Support Enf’t, U.S. Dep’t of Health & Hum. Servs., The Child Support Program Is Focused on Performance 2 (2016) (“Child support collections have nearly tripled since 1996, fueled by implementation of computer systems and income withholding.”); Rebekah Selekman & Amy Johnson, Mathematica, An Examination of the Use and Effectiveness of Child Support Enforcement Tools in Six States 11 (2019) (noting growing use of “predictive analytic models” to tailor enforcement actions).
These dynamics are complex—and data is somewhere between scarce and nonexistent. But our hunch is that, when it comes to well-resourced actors, technology is enabling a miniaturization of disputes. With new tech-powered tools, institutional plaintiffs of all stripes can dip deeper into the pool of possible cases and initiate litigation that was not cost-justified in an analog world.
On the other side of the “v,” however, the picture is different. For a range of reasons, tech-based efficiencies—and the scale economies they enable—are largely unavailable to the individual litigants. Sometimes, hurdles are explicit and formal: In many states, astonishingly, only represented parties can e-file. 70 .Nat’l Ctr. for State Cts., Self-Represented eFiling: Surveying the Accessible Implementations 3 (rev. 1 2022) (observing self-represented litigants are not allowed to efile in eight states: Kansas, Mississippi, Missouri, Montana, New Jersey, New Mexico, South Carolina, and South Dakota). In others, SRLs can only e-file if they are litigating certain kinds of claims. 71 .Compare E-Filing for Non-Attorneys, Colo. Jud. Branch, https://perma.cc/3U44-E23Q (archived Mar. 31, 2024) (allowing non-attorneys to e-file only when self-representing in a domestic relations case), with E-Filing for Attorneys, Colo. Jud. Branch, https://perma.cc/C9ZQ-RXYS (archived Mar. 31, 2024) (allowing licensed attorneys to e-file “for civil, criminal, domestic, water, probate, and appellate court cases”).
In still other states, formal rules are evenhanded, but they predictably affect different players differently. For instance, in Indiana, everyone can e-file, but you must first register online, then either wait for a snail-mailed PIN or verify your identity in person at the county clerk’s office 72 .Party Access to MyCase, Ind. Jud. Branch, https://perma.cc/JDS2-FMHR (archived Mar. 31, 2024). —not much of a burden for an institutional player, but a headache for someone going it alone. Meanwhile, the “legal tech” that might help SRLs, from question-and-answer (Q/A) systems to online form-filling tools, is somewhere between rudimentary and non-existent. 73 .See generally Rebecca L. Sandefur, Legal Tech for Non-Lawyers: Report of the Survey of U.S. Legal Technologies (2019) (describing the limitations of those tools that do exist and the access to justice inequities they perpetuate). No TurboTax equivalent for poor people facing debt collections, evictions, or child support enforcement exists at scale.
Why is consumer-side legal tech so anemic? Some contend that restrictive rules have choked off innovation (think UPL restrictions, for example, or rules requiring that entities providing legal services be exclusively owned, operated, and financed by licensed lawyers). 74 .E.g., Gillian K. Hadfield, Legal Markets, 60 J. Econ. Lit. 1264, 1265, 1280, 1298 (2022) (describing UPL, organizational form, and other regulations and the ways in which they “hamper our ability to generate investment in legal and regulatory technology”). For how certain states are relaxing these restrictions, see generally David Freeman Engstrom, Lucy Ricca, Graham Ambrose & Maddie Walsh, Stan. L. Sch.: Deborah L. Rhode Ctr. on the Legal Pro., Legal Innovation After Reform: Evidence from Regulatory Change (2022). Others blame federalism, arguing the checkerboard of technology systems across the nation’s 16,000 court jurisdictions defeats the scale tech developers need to invest in robust, SRL-friendly tools. 75 This is the theory of change that motivates the Filing Fairness Project, a six-state collaboration to make state court systems more accessible to SRLs and tech providers who might serve them. See Filing Fairness Project, Stan. L. Sch.: Deborah L. Rhode Ctr. on the Legal Pro., https://perma.cc/58N4-VX64 (archived Mar. 31, 2024). Still others have theorized that (at least until ChatGPT came along) even the best AI could not perform the translational work necessary to cut through legalese and explain outcomes and options to unsophisticated litigants, thus limiting legal tech’s reach. 76 John Armour & Mari Sako, Lawtech: Leveling the Playing Field in Legal Services?, in Legal Tech and the Future of Civil Justice 44, 54-55 (David Freeman Engstrom ed., 2023) (explaining that AI’s limitations still necessitate the need for a human lawyer—thereby making the technology cost-prohibitive for smaller PeopleLaw entities).
However one weighs these possibilities, they all lead to the same place: Compared to institutional plaintiffs, individuals litigate—or, often, they don’t litigate—using only analog tools. Legal tech is lopsided. This skew has supercharged the capacity of institutional litigants while depriving individuals, and the legal services providers who might help them, from harnessing its efficiencies.
IV. Implications
Seeing the what, when, and why of the A2J crisis reveals the enormity of the challenge. From debt collection to eviction to child support enforcement, the fusion of economic precarity and potent but unevenly distributed technologies has wrought a tsunami of cases that, though highly consequential for the parties involved, fit poorly within existing procedural frameworks. The result is a glaring mismatch between what our courts are designed to do (adjudicate cases through adversarial, individual, lawyer-centered litigation) and what we now ask them to do (very often, assembly-line eviction orders and wage garnishments). 77 .See generally Colleen F. Shanahan, Jessica K. Steinberg, Alyx Mark & Anna E. Carpenter, The Institutional Mismatch of State Civil Courts, 122 Colum. L. Rev. 1471 (2022). Viewed through this lens, the current A2J crisis is not just a threat to equality or a test of legitimacy. It is an existential challenge to courts as we know them.
That might sound breathless, but it is also empowering as we take the measure of possible fixes—including those reviewed at the outset. 78 .See supra notes 4-5 and accompanying text. Indeed, our effort at an excavation of the origins of the current A2J crisis offers numerous lessons for the future. Here we note just three.
First, a clearer understanding of the making of the A2J crisis can steer us away from unproductive claims and false starts. Stagnating legal aid and insufficient pro bono didn’t cause the crisis—and more of either offers only the most partial of solutions. Nor should we continue to comfort ourselves with happier explanations for why so many litigants go it alone. As Part II showed, the access crisis is not traceable to a salutary mix of rights consciousness, “increased literacy,” “a sense of rugged individualism,” or distrust of lawyers. 79 .See supra Parts II.C-D. These explanations are popular. They are also seductive. If true, they would blunt lawyers’ moral responsibility to act. But, as we have explained, the rosier stories centered on plucky individual empowerment are belied by gloomier evidence—and that evidence indicates that there is a bona fide problem that must be addressed.
A second lesson is directed to researchers. Going forward, we must continue to drill down on the above dynamics, from the direct causes of the access crisis (for example, the rise of tech-enabled institutional plaintiffs) to abetting ones which help to explain why the system has not adapted (for example, the innovation-stymieing checkerboard of current court technology). Only by understanding how institutional plaintiffs do, and do not, respond to interventions and incentives—and only by understanding which levers are promising—can we derive an optimal mix of reforms.
More and better research can also help weigh the hard choices that any mature institutional reform movement must make. As just one example, we don’t know whether restrictive rules, the checkerboard of court technology systems, or AI’s innate limits best explain why there’s so little legal tech to assist SRLs. However, understanding the contribution of each is critical to deciding how best to direct reform energies. Should reformers focus on regulatory reform in order to welcome non-lawyer and software-based providers into the system? Or should we try to improve and standardize disparate court technology systems to make them more accessible to SRLs and the tech providers who want to serve them? In a world of limited resources, where is the low-hanging fruit?
Finally, a better grasp of the making of the current access crisis helps calibrate reform impulses. One impulse is to go big—to conclude that tectonic forces, including stagnant wages, rising health care costs, and relentless rent increases, are at the heart of the A2J problem, and that all must be addressed in order to fix it. Yet, given existing political constraints, that seems fanciful—and putting our eggs in the “build a better welfare state” basket seems destined for defeat. On the other end of the continuum, it is tempting to think that what we need is small-batch, local experimentalism—that a diverse and well-intentioned mix of multi-faceted and interconnected strategies undertaken by lawyers, judges, court staff, legal aid, law schools, allied legal professionals, and community-based organizations will get there. While appealing, these efforts are unlikely to achieve meaningful change.
Our gloomy, Goldilocks-style hunch is that we should be pursuing advocacy and action in a mid-level sweet spot; we need ambitious but achievable efforts to reset some of the system’s cornerstones. At a minimum, that means rethinking technologies, and their sharp asymmetries, at all levels. It might mean reforming UPL laws to relax lawyers’ stranglehold over the provision of legal services. It might entail relaxing Rule 5.4(d), so that non-lawyer-owned entities can provide legal services for certain clients and customers. 80 For how legal services were provided through auto clubs, banks, unions, and homeowners associations in the early years of the last century, see generally Nora Freeman Engstrom & James Stone, Auto Clubs and the Lost Origins of the Access-to-Justice Crisis, 134 Yale L.J. (forthcoming 2024). And it might mean reimagining how justice is administered—for instance, how judges perceive and perform their role in dockets that overwhelmingly lack safeguards that can mediate an adversarial process within which some fare systematically better than others. 81 .See Hum. Rts. Watch, supra note 10, at 32-53, 61 (describing how debt collection actions tend to pit represented plaintiffs against unrepresented defendants and yet, notwithstanding this skewed adversarial context, “[m]any judges bind themselves with overly rigid notions of judicial neutrality that prevent rigorous examination of plaintiffs’ claims”). Getting the system’s cornerstones right may be the only way forward—and the most plausible way to achieve the significant change the situation demands.
* Nora Freeman Engstrom is the Ernest W. McFarland Professor of Law at Stanford Law School, and David Freeman Engstrom is the LSVF Professor in Law at Stanford Law School. Both co-direct the Deborah L. Rhode Center on the Legal Profession. We are grateful to Graham Ambrose, Kelsea Ahjin Jeon, and Garrett Wen for excellent research assistance, to Todd Venook for thoughtful feedback on previous drafts, and to the Editors of Volume 75 of the Stanford Law Review for their extraordinary symposium on access to justice.